Homer
Area Description & History
Homer is located on the north shore of Kachemak Bay on the southwestern edge of the Kenai Peninsula. This is the traditional territory of the Kenaitze people, a branch of Athabascan Native Peoples who speak Dena’ina. Today, fewer than 100 people speak this language and efforts to preserve it are led by the Tribe’s Dena’ina Language and Culture Revitalization Project.1 Historically, the Kenaitze had summer fish camps along the rivers and shores of Cook Inlet. In 1895, workers from the Alaska Gold Mining Company settled in the area and named the community after Homer Pennock, a gold mining company promoter.2 Commercial fisheries began in the Cook Inlet in the mid-1800s with salmon and herring. Commercial exploitation of halibut and groundfish first extended into the Gulf of Alaska in the 1920s. The first year-round processing facility in Homer opened in 1954 specializing in frozen king crab and shrimp. The city government was incorporated in March 1964. Today, Homer is located in the Lower Cook Inlet state Fishery Management Area, Federal Statistical and Reporting Area 630, Pacific Halibut Fishery Regulatory Area 3A, and the Central Gulf Federal Sablefish Regulatory Area1. Homer is in House District 31, Senate District P. Homer was not included under the Alaska Native Claims Settlement Act (ANCSA). The Aleut Ninilchik Native Association is the primary Native Association active in the city.
Infrastructure & Transportation
Homer is often referred to as “The End of the Road,” because it lies at the terminus of the Sterling Highway. The state owns and operates the Homer Airport, which has an asphalt runway, float plane basin, and a seaplane base at Beluga Lake. The Alaska Marine Highway and local ferry services provide water transportation.3 There are several medical facilities and eight schools in the Homer area. School enrollment has decreased 10% since 2008 but is up 16% from a low in 2020, likely due to the COVID-19 pandemic.4 Road and other transportation access,5 as well as the presence of schools and medical care, ensure that residents have access to necessary services and infrastructure that support community resilience.
Demographics
Homer’s population has been steadily increasing between 2010 and 2020. In 2021, population declined by 5% before increasing again in 2022. With increases in population, the proportion of the population over 65 has also increased, suggesting that older individuals are moving to Homer while the proportion of young children (under 5 years) is declining. Approximately 87%, on average, of the population identified as white between 2018 and 2022, down 3% from the 2010 to 2014 average, while approximately 6% of the population identifies as American Indian or Alaskan Native, up 1% from the 2010 to 2014 average.
The percentage of the population 25 years and older with a high school diploma (or equivalent) or higher has remained stable since 2010, with an average of 95% of the population having a high school diploma or higher between 2018 and 2022. Additionally, the median household income (in 2022 USD) has remained stable between 2010 (~$69,000) and 2022 (~$70,000). Within this time period, however, the percentage of the population that lives below the poverty line has increased from 8% in 2010 to 13% in 2022, suggesting an increase in wealth disparity.
| Demographics | |
| Population | 5,669 |
| Population in group housing | 175 |
| Median household income | $69,757 |
| Housing units | 2,941 |
| Percentages | |
| Male | 51.2% |
| Female | 48.8% |
| White | 80.4% |
| American Indian or Alaska Native | 7.7% |
| Black or African American | 0.2% |
| Asian | 1.7% |
| Native Hawaiian or Pacific Islander | 0.4% |
| Hispanic or Latino | 4.3% |
| Below poverty line | 12.7% |
| High school diploma or higher | 95.2% |
| Population under 5 | 4.6% |
| Population over 18 | 81.1% |
| Population over 65 | 22.2% |
| Source: US Census Bureau American Community Survey 5-year estimates (2018-2022) | |
| Population and group housing estimates sourced from Alaska Department of Labor, 2023 | |
Current Economy
While commercial fishing has long been the mainstay of the Homer economy, tourism has become increasingly prominent.6 In 2022, Homer generated $3,559,504 in property tax and $12,178,465 in sales tax.7
These revenues support city services including education, sanitation, and transportation. In 2022, per capita income was estimated to be $42,604 and the median household income was estimated to be $69,757.8 The percentage of the population living below the poverty line was 12.7%, a slight downtick from last year.8 These measures are important for understanding the current economic wellbeing of residents and indicate potential changes in their economic security. Additionally, these factors contribute to the community’s ability to adapt to stressors, such as food security issues and climate change.
Climate Change Vulnerability and Adaptive Capacity
Exposure to Biophysical Effects of Climate Change
A community’s exposure to the biophysical effects of climate change, which include impacts to the biological organisms and physical landscape surrounding them, aids in determining their vulnerability. Biophysical risks to the Gulf of Alaska as a whole include sea level rise, coastal erosion, extreme weather events, changes in precipitation (rates, timing, and snowpack), increasing landslides and avalanches, and increased storm severity. The City of Homer’s Hazard Management Plan8 describes the potential biophysical hazards of climate change as: sea level rise, coastal erosion, increased average annual maximum temperature, increased average annual precipitation, severe moisture deficit/drought, and wildfires. The plan further details these biophysical effects as:
Sea level rise: 15% of the critical facilities and infrastructure in the city are in the low-lying areas on the Homer Spit and will be at risk of inundation. Flooding due to sea level rise will cause destructive erosion; flooding; and soil contamination with salt; loss of habit for fish, birds, and plants; disruption and/or delay of transportation; and damages to homes and businesses on a more regular basis.
Temperature and precipitation: SNAP temperature models show that all of Homer will experience a temperature increase of 5.3ºF by the end of the century, while precipitation models show that for the same reporting period, Homer will see an average rainfall increase of 2.8 inches. In the summer, an increase in temperature will cause an increase in fire risk.
Mega storms that are linked to climate change can cause severe flooding. Along the coast, deadly and destructive storm surges may push farther inland than they once did, which means more frequent nuisance flooding.
Dependence on Fisheries Affected by Climate Change
Reliance on fishery resources affected by climate change may influence a community’s degree of vulnerability to climate driven disruption. The city of Homer is highly engaged in commercial fishing activities, including groundfish harvesting and processing. A number of fishery downturns have affected the community in the last several years. In 2020, and again in 2023, the Homer community experienced a closure of commercial Chinook salmon fisheries in Cook Inlet federal waters. In 2024, much of the Gulf of Alaska experienced substantially worse than projected pink salmon returns. The Lower Cook Inlet harvested just over 8.5 thousand pink salmon, compared with an 11-year average of 600,000 pink salmon.9 Recent fishery closures compound market volatility and associated steep price declines in 2023. In turn, these events compound increased costs and decreased revenues during the COVID pandemic as well as the closure of the directed commercial Pacific cod fishery in the Gulf of Alaska in 2020, which greatly affected numerous fishermen in Homer.
Recreational and subsistence fishing also play important roles in Homer’s economy, wellbeing, and culture. Sport fishing provides an additional source of food, and supports the local economy through the money spent on lodging, guide services, equipment, and supplies.10 In 2024, multiple Chinook sport fisheries were closed around Homer due to preseason projections of salmon returns.
Subsistence fishing is an important part of Homer’s fisheries. Subsistence practices continue to support social networks and cultural identity, increased nutritional options, and contribute to food security in the region.
As the effects of climate change continue to impact commercial, recreational, and subsistence fisheries in this region, Homer is vulnerable to economic and social disruption.
NOAA Fisheries developed a national Community Social Vulnerability Indicators Toolbox that currently comprises a suite of 14 statistically robust social, economic, and climate change indicators that attempt to characterize and evaluate a community’s vulnerability and resilience to disturbances (such as regulatory shifts, extreme weather, oil spills, sea level rise, etc.). A selection of these indicators most relevant to the Alaska region is included below.
Local Adaptive Capacity
Social indicators for Homer indicate that labor force structure, population composition, and levels of personal disruption are low risk; however poverty levels are medium risk and infrastructure in the community, specifically housing characteristics, have a moderately high vulnerability to coastal hazards which therefore increases overall vulnerability.11 These indicators serve to inform about a community’s potential vulnerability in the face of diverse stressors, including climate change. However, it is important to keep in mind that these indicators are not specific to the fishing fleet, which could have different levels of vulnerability than the overall community.
| Social Indicators for Fishing Communities* | |
| Labor Force | LOW |
| Housing Characteristics | MED-HIGH |
| Poverty | MED |
| Population Composition | LOW |
| Personal Disruption | LOW |
| *Source: NOAA Fisheries Office of Science and Technology. 2019. NOAA Fisheries Community Social Vulnerability Indicators (CSVIs). Version 3 (Last updated December 21, 2020). https://www.fisheries.noaa.gov/national/socioeconomics/social-indicators-fishing-communities-0 | |
Groundfish Harvesting Engagement - HIGH
Homer fishers are diversified in commercial fisheries, including salmon, halibut, crab, groundfish, and herring. Salmon dominates the share of harvest revenue; however, a number of fishing vessels use Homer as a base of fishing operations.18 In 2023, 399 (up by 5 vessels) vessels were registered to Homer residents, of which 100 (up by 4 vessels) were groundfish vessels. On average, from 2019-2023, the majority of harvest revenue came from salmon (63%) (down by 2% from last year), then halibut (17%) (up by 1%). Fishing vessels owned by Homer residents continued a slight downward trend from a peak of 410 in 2015 to 390 in 2021, then gained 4 in 2022 and 5 more in 2023 (up by 2.3% from 2021). In 2020, ownership of groundfish vessels was at its lowest across the entire 2008-2023 period, increasing in 2023 to 100 vessels. The pounds of groundfish harvested increased to 25.5 million pounds (up 10% from last year). Meanwhile, the ex-vessel value declined, bringing in $13.8 million (a decrease of 35%).
Crab Harvesting Engagement - MEDIUM
Homer’s resident vessels harvesting BSAI crab fisheries saw a dramatic decline in both harvest volume and associated ex-vessel value in 2022. In 2016, BSAI harvests decreased by 1.6 million pounds (44%), and $2.2 million (22%) compared to 2015. In 2017, harvests fell again by 1.4 million pounds (73%) and $5.5 million in ex-vessel value (down 70%). BSAI crab fisheries began a gradual upward slope until 2022, when both pounds harvested and ex-vessel value plummeted further. Homer’s resident vessels harvested 105K pounds (down 40% from 2022) of BSAI crab with an ex-vessel value of $1.4 million (up 13% from 2022) in 2023. Quota shareholders decreased from 13 (2022) to 12 (2023). The number of crew residing in Homer participating in FMP crab fisheries continued to fall from 12 (2022) to 10 (2023).
Subsistence Harvesting
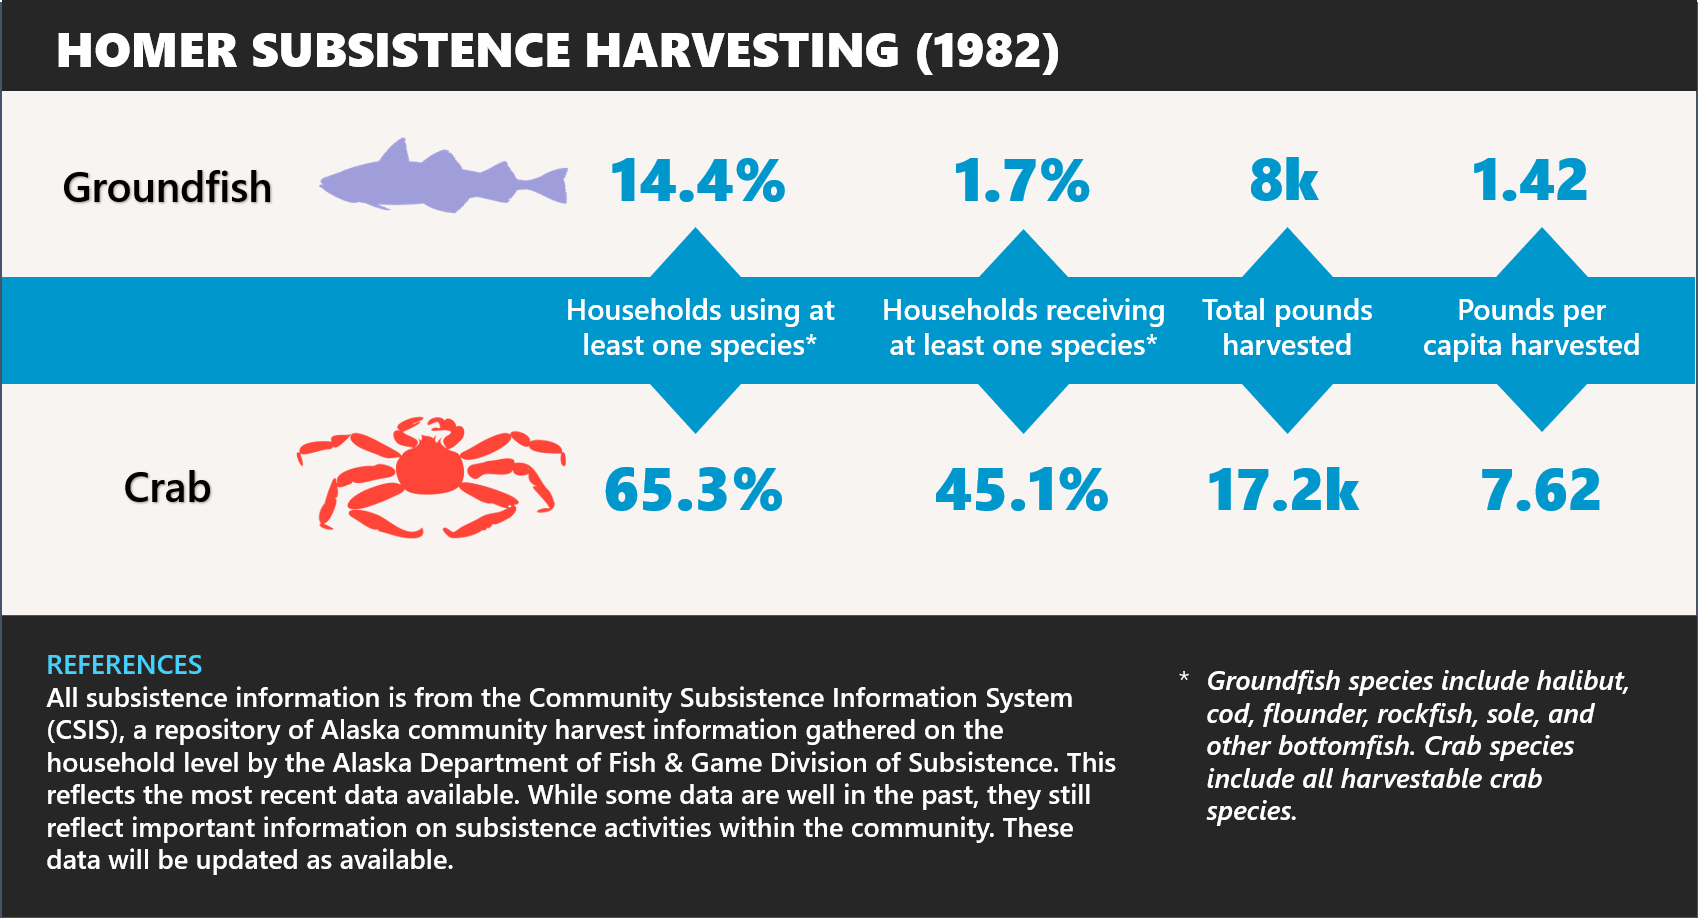
The residents of Homer take part in a wide range of subsistence hunting and fishing activities. While there is limited data on this community’s subsistence engagement, with the most recent comprehensive data for Homer in the State of Alaska’s Community Subsistence Information System dating from 2008, the data provides a snapshot into the historic use of these fisheries in this community. Historically, Homer residents have been highly engaged in subsistence with a widely diverse harvesting portfolio that included salmon, crab, bivalves, seabirds, and marine mammals. In 2022, the number of Alaska subsistence and personal use permits was 541 (14% increase from 2020), harvesting a total of 10.8 thousand fish across all species of salmon, with 90% sockeye salmon.12 Many of these fishers have strong social networks in the area and participate in the subsistence economy through harvesting and sharing their catch.13 Homer has seen an increase in salmon subsistence harvest and a decrease in subsistence halibut. In 2022, the number of Halibut subsistence permits (SHARC) issued was 3 harvesting 182 pounds of halibut (a decrease of 70% compared to 2020). This could be due to the COVID-19 pandemic, which likely affected residents’ ability to participate in the fishery.1415
Recreational Fishing Engagement
Homer is one of the four communities in Alaska that has been highly engaged in recreational fishing in all years 2004-2023 as well as highly engaged in commercial fishing (harvesting or processing), the others being Kodiak, Seward, and Sitka. Homer consistently ranked sixth or seventh highest engaged community over this period but has recently increased its engagement score to a new high in 2023.
Groundfish Processing Engagement - MEDIUM-HIGH
Although halibut dominates the processing sector (accounting for 76.8% of landed value on average from 2019-2023), Homer is one of the leading groundfish processing communities in Alaska. In 2023, Homer’s processing sector processed 5 million pounds of groundfish with an associated ex-vessel value of $2.8 million. This represents a 25% increase in pounds harvested and a 12% increase in ex-vessel value from 2022. Pollock showed the largest decline, with volume dropping 28% compared to 2022 and 64% in associated value. Sablefish also showed decreases in volume (-14% from 2022) and value (-51% from 2022). In 2023, groundfish comprised 38% of total volume processed in Homer, a 18% increase since 2021, and 10% of processing revenue, up 6% from 2021. The number of processors increased in 2023 to 91, from 71 processors in 2022.
Crab Processing Engagement - LOW
There is not a substantial amount of crab processing activity in Homer to report.
Kenaitze Indian Tribe. (n.d.). Home. Kenaitze Indian Tribe. https://www.kenaitze.org/↩︎
Armstrong, M. (2014, July 23). Parks Day: Celebrating early Homer Spit history. Homer News. https://www.homernews.com/life/parks-day-celebrating-early-homer-spit-history/↩︎
Alaska Department of Commerce, Community, and Economic Development. (n.d.). Homer, Alaska. https://dcced.maps.arcgis.com/apps/MapJournal/index.html?appid=3c2b1529debe4bfdb4babe4038a6db2f↩︎
School enrollment statistics compiled from AK. Dept. of Education & Early Development. http://www.eed.state.ak.us/stats/↩︎
Alaska Department of Commerce, Community, and Economic Development. (n.d.). Road connection in community. ArcGIS Open Data. https://dcra-cdo-dcced.opendata.arcgis.com/datasets/DCCED::road-connection-in-community/explore↩︎
Alaska Community Survey, Alaska Fisheries Science Center 2013↩︎
Tax data from AK. Dept. of Revenue, Annual Reports 2008 2008-2021. Retrieved 06/30/2022 from http://tax.alaska.gov/programs/sourcebook/index.aspx aspx; and Dept. of Commerce AK Taxable Database, AK Division of Community & Regional Affairs. Retrieved 10/2022.↩︎
City of Homer. (2018). City of Homer All All-Hazard Mitigation Plan. https://www.cityofhomer-ak.gov/sites/default/files/fileattachments/fire/page/42801/red_for_web_homer_ahmp_2018_update_final.pdf↩︎
Lopez, S. (2024, October 10). After tough salmon season, Lower Cook Inlet fishermen say it will be a struggle to stay afloat. KBBI. https://www.kbbi.org/local-news/2024-10-10/after-tough-salmon-season-lower-cook-inlet-fishermen-say-it-will-be-a-struggle-to-stay-afloat↩︎
Alaska Dept. of Fish and Game. (2009). Economic Impacts and Contributions of Sportfishing in Alaska. https://www.adfg.alaska.gov/static/home/library/pdfs/sportfish/2007economic_impacts_of_fishing.pdf↩︎
NOAA Fisheries Office of Science and Technology. 2019. NOAA Fisheries Community Social Vulnerability Indicators (CSVIs). Version 3 (Last updated December 21, 2020). https://www.fisheries.noaa.gov/national/socioeconomics/social-indicators-fishing-communities-0↩︎
Brown, Caroline L., T. Bembenic, M. Brown, H. Cold, J. Coleman, E. Donaldson, J. Egelhoff, B. Jones, J.M. Keating, L.A. Sill, M. Urquia, C. Wilcox, and T. Barnett. 2023. Alaska Subsistence and Personal use Salmon Fisheries 2020 Annual Report. Alaska Department of Fish and Game Division of Subsistence, Technical Paper No. 494, Anchorage.↩︎
Brown, Caroline L., T. Bembenic, M. Brown, H. Cold, J. Coleman, E. Donaldson, J. Egelhoff, B. Jones, J.M. Keating, L.A. Sill, M. Urquia, C. Wilcox, and T. Barnett. 2023. Alaska Subsistence and Personal use Salmon Fisheries 2020 Annual Report. Alaska Department of Fish and Game Division of Subsistence, Technical Paper No. 494, Anchorage.↩︎
Alaska Department of Fish and Game Division of Subsistence. 2021. Alaska Subsistence Fisheries Database. Data compiled by Alaska Fisheries Information Network in the Alaska Community Profiling Dataset.↩︎
Alaska Department of Fish and Game Division of Subsistence. 2011. Pacific Halibut Subsistence Data. Data compiled by Alaska Fisheries Information Network in Alaska Community Profiling Dataset.↩︎