Seward
Area Description & History
Seward is located at the head of Resurrection Bay on the Kenai Peninsula, and is the gateway to the Kenai Fjords National Park. Seward’s earliest residents were the Unegkurmiut, a subgroup of the Alutiiq Chugash. The City was founded in 1903 and, as an ice-free harbor, Seward has become an important transport and supply center for Interior Alaska. Seward was incorporated in 1912, and became a strategic military port during WWII. Seward was not included under the Alaska Native Claims Settlement Act, although the Qutekcak Native tribe is active in the area and seeking federal recognition. Qutekcak translates from the Alutiiq language as “Big Beach.” Qutekcak was a prehistoric Alaska Native mixing area, serving as a crossroads for the various Alutiiq and Sugpiaq groups residing in the region.1 The first commercial salmon fishery in Prince William Sound (PWS) developed along the Copper River Delta around 1900. Commercial exploitation of halibut and groundfish first extended into the Gulf of Alaska (Gulf) in the 1920s. During this time, herring became increasingly valued for oil and meat, and a number of reduction plants were also built. Commercial crab fisheries began to develop in the Gulf in the 1930s. The marine waters at the outlet of Resurrection Bay are included within Federal Statistical and Reporting Area 630, Pacific Halibut Fishery Regulatory Area 3A, and the Central Gulf Sablefish Regulatory Area. In addition to federal groundfish fisheries that take place in the Central and Eastern Gulf, state groundfish fisheries take place in the inland waters of Cook Inlet and PWS for rockfish, lingcod, pollock, sablefish, and Pacific cod.
Infrastructure & Transportation
Seward is accessible by air, water, highway and rail. Bus and other commercial trucking services are available daily from Anchorage. The deep water port remains ice-free year round, and services cruise ships, and other cargo barges from Seattle. The small boat harbor has slips for 650 boats. All water, waste collection, and power services are offered through the city and the borough. Medical services in Seward are provided by the Providence Seward Medical Center. ADF&G and NMFS both have offices in Seward. Seward has 3 schools, where student enrollment has decreased by 13% since 2008.1 Additionally, Seward schools experienced an 18% enrollment decrease between 2019 and 2020,2 which is likely a result of the COVID pandemic.
Demographics
| Demographics | |
| Population | 2,582 |
| Population in group housing | 736 |
| Median household income | $77,850 |
| Housing units | 1,227 |
| Percentages | |
| Male | 65.3% |
| Female | 34.7% |
| White | 70.7% |
| American Indian or Alaska Native | 12.5% |
| Black or African American | 3.0% |
| Asian | 1.6% |
| Native Hawaiian or Pacific Islander | 4.9% |
| Hispanic or Latino | 1.4% |
| Below poverty line | 6.1% |
| High school diploma or higher | 94.9% |
| Population under 5 | 3.7% |
| Population over 18 | 79.3% |
| Population over 65 | 17.2% |
| Source: US Census Bureau American Community Survey 5-year estimates (2018-2022) | |
| Population and group housing estimates sourced from Alaska Department of Labor, 2023 | |
Current Economy
Seward’s economy is shaped by its role as a transportation hub. The economy is diversified and includes commercial fishing and processing, shipping, coal export, employment through the state prison and tourism fueled by its proximity to Kenai Fjords National Park. In 2023, Seward generated $320,495 in total fishery related taxes (including shared and municipal).3 The overall amount of total fish taxes collected in 2023 decreased by 8% from 2021.3 These revenues support basic city services such as education, sanitation, transportation, etc. and are important indicators of community health and wellbeing. In 2022, per capita income in Seward was estimated to be $34,044,4 and the median household income was estimated to be $77,850.3 This represents a 22% increase and a 5% increase in these measures respectively compared to 2019. The percentage of the population living below the poverty line has decreased by 6% since 2019.4
Climate Change Vulnerability and Adaptive Capacity
Exposure to Biophysical Effects of Climate Change
A community’s exposure to the biophysical effects of climate change, which include effects to the biological organisms and physical landscape surrounding them, aids in determining their vulnerability. Biophysical risks to the Gulf of Alaska as a whole include sea level rise, coastal erosion, extreme weather events, changes in precipitation (rates, timing, and snowpack), increasing landslides and avalanches, wildfire risk, and increased storm severity. Seward’s hazard management plan (HMP) dates back to 2010; however, the Kenai Peninsula Borough is currently updating its HMP which will include Seward. Seward’s 2010 HMP lists a number of hazards that may be exacerbated by climate change–flooding, coastal erosion, wildfire, and extreme weather. The community has also experienced landslides in recent years, which can be exacerbated by extreme weather events. Seward is further vulnerable to increasing glacial lake outburst flooding as the Snow Glacier near the community has thinned. Over the last 20 years, these floods have become “more frequent, peaked more rapidly, and have had generally higher peaks.”5 A community forum from 2019 on the topic of a climate action plan indicates that residents are concerned about flooding, droughts, wildfires, sea level rise, and various impacts of climate change on ocean health including acidification, toxic algae blooms, glacial melts, and increased shipping and tourism.6
Dependence on Fisheries Affected by Climate Change
Reliance on fisheries resources which are being impacted by climate change can determine how vulnerable a community is to disruption from climate change. The community of Seward is highly engaged in processing within the groundfish fishery. In addition, nearby Kenai Fjords National Park is a popular destination for recreational fishers, with 28 active sport fish guide businesses, making this an important part of the community’s culture and economy. However, residents appear to be only moderately engaged in subsistence fishing within the groundfish and crab fisheries in comparison to other communities. The most widely utilized species include rockfish, greenling, lingcod, and King crab. The community is only moderately engaged in halibut subsistence fishing, but highly engaged in salmon subsistence fishing. Given this, Seward is overall moderately dependent on fisheries resources that will be impacted by climate change. Therefore, as this community is impacted by a changing marine environment, the community’s well-being will be significantly affected.
Local Adaptive Capacity
Seward has moderate to moderately-high vulnerability associated with its housing and various characteristics of its population, such as income level, economic diversity, education, and employment status. The FEMA National Risk Index also rates Seward as having very low community resilience, meaning they have a very low ability to adapt to changing conditions and withstand and recover rapidly from disruptions.7
| Social Indicators for Fishing Communities* | |
| Labor Force | LOW |
| Housing Characteristics | MED-HIGH |
| Poverty | MED |
| Population Composition | LOW |
| Personal Disruption | LOW |
| *Source: NOAA Fisheries Office of Science and Technology. 2019. NOAA Fisheries Community Social Vulnerability Indicators (CSVIs). Version 3 (Last updated December 21, 2020). https://www.fisheries.noaa.gov/national/socioeconomics/social-indicators-fishing-communities-0 | |
Groundfish Harvesting Engagement - MEDIUM
Seward residents participate in several fisheries. In 2023, about 52.5% of ex-vessel value was from groundfish fisheries, while 15.6% was from halibut fisheries, and 38.3% from salmon. In 2023, vessels owned by Seward residents harvested over 2.1 million pounds of groundfish with an associated value of over $4.6 million, showing a steep decline in these metrics from the previous year. Groundfish harvests in Seward peaked in 2013, but have been declining since then. In 2021 and 2022, both pounds harvested and associated ex-vessel value of groundfish harvests increased briefly after a sharp decline in 2020, potentially due to the COVID-19 pandemic. Declines in groundfish harvests were observed again in 2023, with a 50% decrease in volume harvested and 43% decrease in associated value.
In 2023, the number of groundfish vessels owned by Seward residents increased to a total of 12 vessels and the total number of fishing vessels owned by residents decreased to 35. Between 2008 and 2019, the number of groundfish vessels owned by Seward residents fluctuated, peaking in 2011 at 19 vessels. In 2020, despite significant decreases in pounds harvested, the number of groundfish vessels increased to 12 and have remained between 10 and 12 in recent years.
Crab Harvesting Engagement - N/A
There is not a substantial amount of crab harvesting activity in Seward to report.
Due to confidentiality concerns, only select data are available.
Subsistence Harvesting Engagement

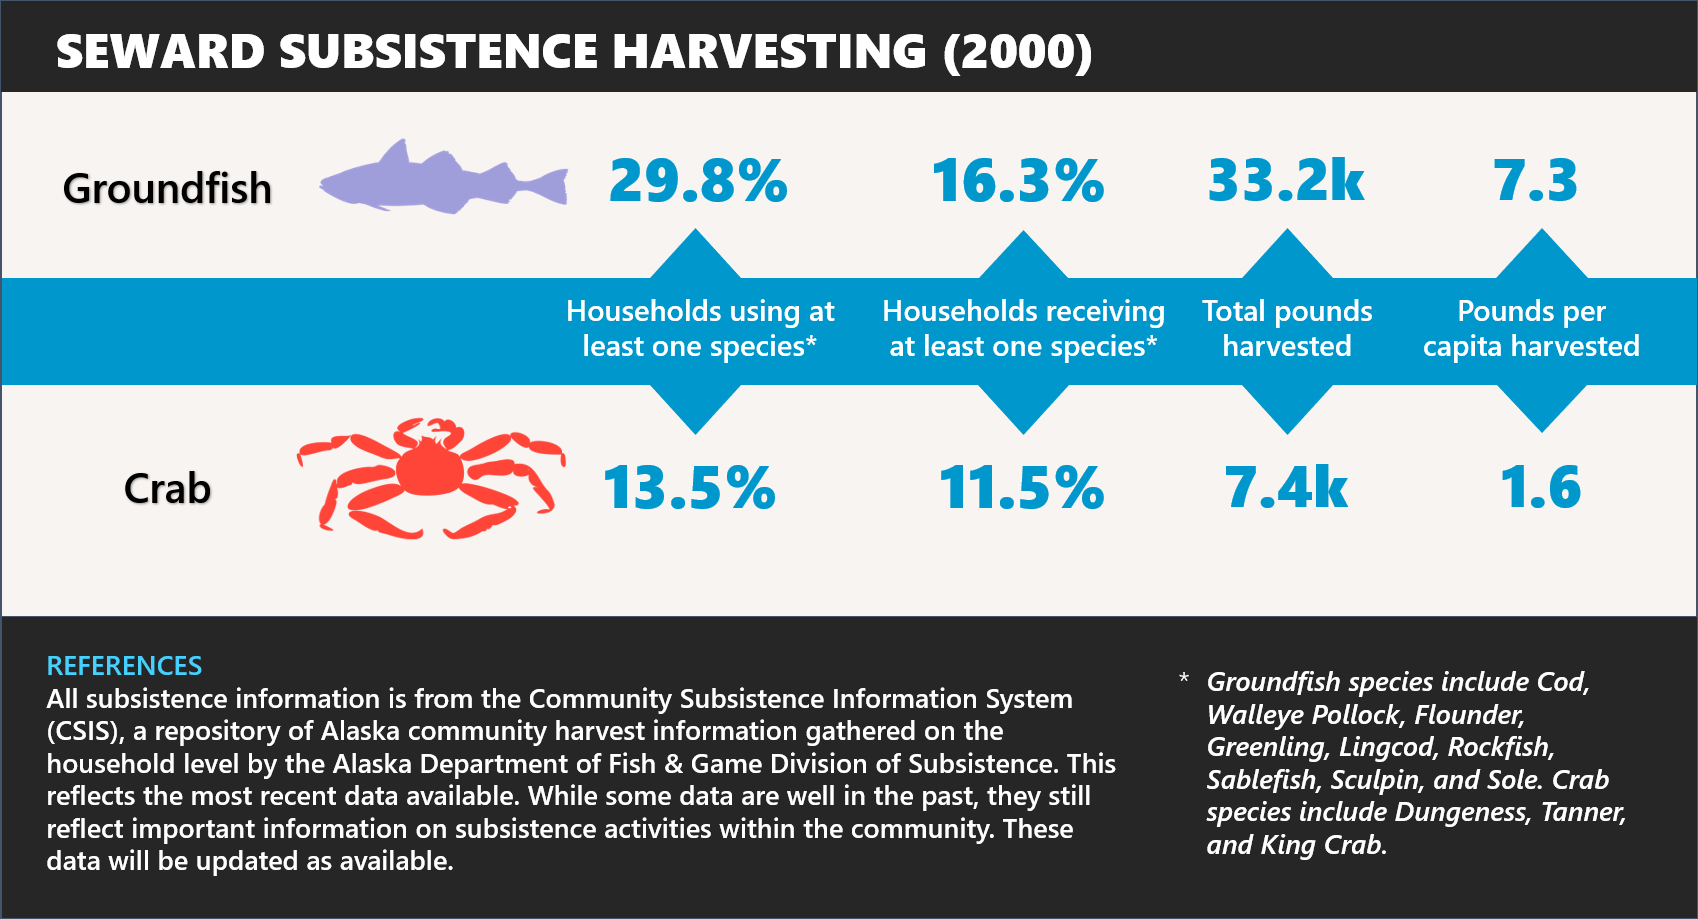
Residents of Seward are moderately engaged in subsistence fishing in groundfish and crab fisheries, according to the most recent data available. The most popular groundfish species were rockfish, greenling and lingcod, while the most widely utilized crab species were King crabs. Similarly, residents are only moderately engaged in subsistence halibut harvests. Recorded harvests of halibut shrank to 0 in the most recent year data was available, 2016.8 By contrast, subsistence salmon fishing has long been practiced in the area, and Seward residents have been recorded harvesting higher amounts of salmon for subsistence since 1999, reaching a peak in 2012. Harvests of subsistence salmon saw a dramatic increase in 2019 from 2018 levels, which remained high through 2022. The same upward trend was observed in the nearby Kenai Peninsula community of Homer, which also saw dramatic increases in salmon harvests in 2019 that persisted to 2022.9
Recreational Fishing Engagement
Seward is one of the four communities in Alaska that has been highly engaged in recreational fishing in all years 2004-2023 as well as highly engaged in commercial fishing (harvesting or processing), the others being Homer, Kodiak, and Sitka. Unlike these other communities however, Seward was not highly engaged in 2003, the first year of the study period. Seward increased its average recreational fishing engagement score from an average of 1.24 from 2003-2009 to an average of 1.58 from 2010-2019 and 1.64 for 2020-2023 despite its engagement score falling to 1.49 in 2023 which is slightly above its overall mean.
Groundfish Processing Engagement - MEDIUM
In 2023, there were five processing plants in Seward that processed groundfish. Processing facilities landed 9.5 million whole pounds with an associated value of $14.2 million. This shows a recent trend of increased groundfish landings and value from 2021 to 2023, compared with the same metrics from 2018 to 2020.
Crab Processing Engagement - N/A
There is not a substantial amount of crab processing activity in Seward to report.
Due to confidentiality concerns, only select data are available.
School enrollment statistics compiled from AK. Dept. of Education & Early Development. Retri eved November 14, 2024 at http://www.eed.state.ak.us/stats/↩︎
School enrollment statistics compiled from AK. Dept. of Education & Early Development. Retri eved November 14, 2024 at http://www.eed.state.ak.us/stats/↩︎
U.S. Census Bureau. (2023). American Community Survey 5-Year Estimates, 2018-2022. U.S. Department of Commerce. Retrieved from https://www.census.gov/data↩︎
U.S. Census Bureau. (2023). American Community Survey 5-Year Estimates, 2018-2022. U.S. Department of Commerce. Retrieved from https://www.census.gov/data↩︎
Beebee, R. A. (2022). Recent history of glacial lake outburst floods, analysis of channel changes, and development of a two-dimensional flow and sediment transport model of the Snow River near Seward, Alaska (Scientific Investigations Report No. 2022-5099). U.S. Geological Survey. https://doi.org/10.3133/sir20225099↩︎
PACAB Climate Action Plan Public Forum. (2019). https://www.cityofseward.us/home/showpublisheddocument/1612/637060950125430000↩︎
Federal Emergency Management Agency. (n.d.). *National Risk Index: Kenai Peninsula Borough, Alaska.* Retrieved November 13, 2024, from https://hazards.fema.gov/nri/report/viewer?dataLOD=Counties&dataIDs=C02122↩︎
Alaska Department of Fish and Game Division of Subsistence. 2011. Pacific Halibut Subsistence Data. Data compiled by Alaska Fisheries Information Network in Alaska Community Profiling Dataset.↩︎
Alaska Department of Fish and Game Division of Subsistence. 2021. Alaska Subsistence Fisheries Database. Data compiled by Alaska Fisheries Information Network in the Alaska Community Profiling Dataset.↩︎
