Alaska Recreational Fisheries
Alaska Recreational Fisheries
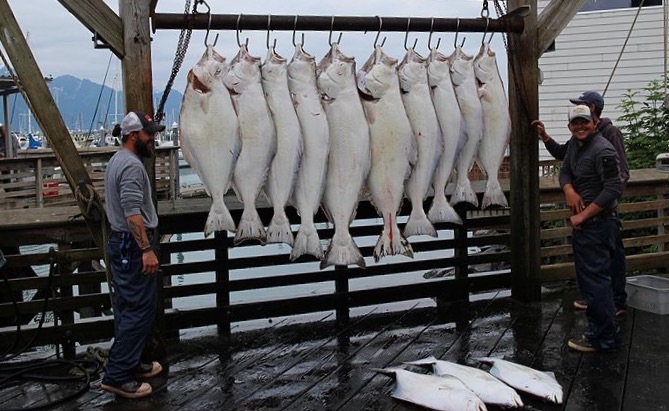
Sport fishing in Alaska provides an important source of income, culture, and food security for resident anglers as well as an important source of tourism revenue from non-resident anglers. These sport anglers fish in both fresh and saltwater using guides, charters, and on their own primarily for salmon (freshwater) and halibut (saltwater). Saltwater recreational anglers alone account for more than 1 million fishing days per year and anglers on charter fishing trips in Alaska catch about half of the approximately 500,000 Pacific salmon and 350,000 halibut harvested by all saltwater anglers in Alaska each year.1
Alaska Community Recreational Fishing Engagement
Data were collected for 296 communities or community groupings throughout the U.S. to create performance metrics of community participation in Alaska recreational fisheries from 2003-2023. Communities were included if they had some amount of sport fishing licenses sold in the community, sportfishing guides, sport fishing businesses, or residents that held sport fishing licenses during this time period. The results of the recreational engagement PCFA analyses are shown here in Table 6.1, which presents the eigenvalues, factor loadings, total variance explained, and Armor’s theta reliability coefficient cited for all variables. The results suggest moderately strong relationships among variables, and that a single index based on the first extracted factor explains over 68.7% of the variation in each of the variables in each year. Figure 6.1 displays the aggregate annual values of the four variables that make up the recreational engagement index for each year to better understand the absolute changes in North Pacific recreational fishing activities that are underlying the relative recreational engagement index. The total number of sport fishing licenses sold to Alaska residents was down -4.09% despite total sportfishing licenses sold in Alaska communities increasing by 15.2%, respectively, in 2023 compared with their 2018-2022 average. There was a modest increase in sport fishing businesses by 3.98%, which employed an additional 7.43% sport fishing guides in 2023 compared with their 2018-2022 average.
| Year |
Eigenvalues
|
Factor Loadings
|
Percent variance explained | Armor's Theta | ||||||
|---|---|---|---|---|---|---|---|---|---|---|
| 1 | 2 | 3 | 4 | Sport fishing licenses sold | Sport fishing guides | Sport fishing business | Residents holding sport fishing licenses | |||
| 2003 | 3.70 | 0.25 | 0.03 | 0.01 | 0.93 | 0.99 | 0.95 | 0.98 | 92% | 0.97 |
| 2004 | 3.68 | 0.26 | 0.04 | 0.02 | 0.92 | 0.98 | 0.95 | 0.98 | 92% | 0.97 |
| 2005 | 3.60 | 0.35 | 0.04 | 0.01 | 0.89 | 0.98 | 0.95 | 0.97 | 90% | 0.96 |
| 2006 | 3.53 | 0.40 | 0.06 | 0.01 | 0.87 | 0.97 | 0.95 | 0.96 | 88% | 0.96 |
| 2007 | 3.50 | 0.38 | 0.10 | 0.01 | 0.87 | 0.96 | 0.95 | 0.97 | 88% | 0.95 |
| 2008 | 3.43 | 0.42 | 0.12 | 0.02 | 0.86 | 0.95 | 0.94 | 0.96 | 86% | 0.95 |
| 2009 | 3.43 | 0.42 | 0.12 | 0.02 | 0.86 | 0.95 | 0.94 | 0.96 | 86% | 0.95 |
| 2010 | 3.40 | 0.45 | 0.13 | 0.02 | 0.86 | 0.94 | 0.93 | 0.96 | 85% | 0.94 |
| 2011 | 3.36 | 0.47 | 0.14 | 0.02 | 0.85 | 0.93 | 0.93 | 0.95 | 84% | 0.94 |
| 2012 | 3.38 | 0.42 | 0.17 | 0.03 | 0.87 | 0.92 | 0.94 | 0.95 | 85% | 0.94 |
| 2013 | 3.32 | 0.47 | 0.18 | 0.03 | 0.85 | 0.92 | 0.93 | 0.94 | 83% | 0.93 |
| 2014 | 3.29 | 0.44 | 0.24 | 0.03 | 0.84 | 0.90 | 0.93 | 0.95 | 82% | 0.93 |
| 2015 | 3.27 | 0.37 | 0.33 | 0.03 | 0.86 | 0.86 | 0.94 | 0.96 | 82% | 0.93 |
| 2016 | 3.21 | 0.42 | 0.34 | 0.03 | 0.85 | 0.82 | 0.94 | 0.96 | 80% | 0.92 |
| 2017 | 3.08 | 0.54 | 0.35 | 0.03 | 0.85 | 0.75 | 0.94 | 0.96 | 77% | 0.90 |
| 2018 | 3.00 | 0.59 | 0.38 | 0.03 | 0.83 | 0.72 | 0.93 | 0.97 | 75% | 0.89 |
| 2019 | 2.96 | 0.65 | 0.36 | 0.03 | 0.84 | 0.68 | 0.93 | 0.97 | 74% | 0.88 |
| 2020 | 2.80 | 0.82 | 0.36 | 0.02 | 0.85 | 0.51 | 0.93 | 0.97 | 70% | 0.86 |
| 2021 | 2.82 | 0.86 | 0.30 | 0.02 | 0.87 | 0.46 | 0.95 | 0.98 | 70% | 0.86 |
| 2022 | 2.79 | 0.88 | 0.31 | 0.02 | 0.87 | 0.43 | 0.94 | 0.98 | 70% | 0.86 |
| 2023 | 2.75 | 0.89 | 0.35 | 0.02 | 0.85 | 0.43 | 0.93 | 0.98 | 69% | 0.85 |
In addition to the goodness of fit statistics of the analyses provided in Table 6.1, each PCFA provides an index score for each of the 296 communities included in the recreational engagement analyses. Table 6.2 displays recreational engagement index results for the 23 communities that were highly engaged in recreational fishing for at least one year between 2003-2023. Communities are defined as highly engaged when their index score is above one, or one standard deviation above the mean of zero.
The recreational engagement index is a relative indicator of community participation compared to the participation of all other communities that participate in recreational fisheries in Alaska. It measures the presence of recreational fishing participation through the number of residents who hold sport fishing licenses, the number of sport fishing licenses sold within the community, the number of sport fishing guide businesses, and the number of sport fishing guides in the community.
Ten of the 23 community groupings listed in Table 6.2 were Highly Engaged in recreational fishing in all years from 2003-2023 : Anchorage, Fairbanks, Homer, Juneau, Kenai, Ketchikan, Kodiak, Sitka, Soldotna, and Wasilla (Seward has been highly engaged for all years after 2003). The other communities that were highly engaged in at least one year over this period include Kenai, King Salmon, Palmer, Craig, Cooper Landing, and Ninilchik. Anchorage has by far the highest degree of engagement over time, even while its index score consistently declines over time. Aside from Anchorage, Soldotna and Juneau have the highest engagement scores over time. Between 2022 and 2023, Anchorage experienced a slight decline in index scores -3.72%, while Soldotna and Juneau experienced moderate increases in index scores, (4.53% and 8.11%, respectively) (Figure 6.2).
Of the other communities that were highly engaged in all years between 2022 and 2023, only Fairbanks experienced a decrease in their recreational engagement index by -2.9%. Ketchikan, Sitka, and Wasilla each experienced small increases in recreational engagement scores between 2022 and 2023 of 1.35%, 1.58%, and 0.237%, respectively. Kodiak experienced a modest 4.99% increase while Homer increased by 11.1%, and Kenai increased by 24.5%.
| 2003 | 2004 | 2005 | 2006 | 2007 | 2008 | 2009 | 2010 | 2011 | 2012 | 2013 | 2014 | 2015 | 2016 | 2017 | 2018 | 2019 | 2020 | 2021 | 2022 | 2023 | |
|---|---|---|---|---|---|---|---|---|---|---|---|---|---|---|---|---|---|---|---|---|---|
| Anchorage | 20.08 | 19.88 | 18.82 | 18.28 | 18.10 | 17.69 | 17.81 | 17.58 | 17.55 | 17.94 | 17.37 | 17.24 | 17.47 | 17.18 | 17.16 | 16.46 | 16.50 | 16.94 | 17.34 | 17.20 | 16.56 |
| Cooper Landing | 0.61 | 0.60 | 0.62 | 0.77 | 0.77 | 0.99 | 1.08 | 1.14 | 1.16 | 1.28 | 1.49 | 1.63 | 1.56 | 1.61 | 1.68 | 1.63 | 1.69 | 1.72 | 1.53 | 1.50 | 1.38 |
| Craig | 0.95 | 0.98 | 1.08 | 1.18 | 1.19 | 1.32 | 1.28 | 1.26 | 1.04 | 1.28 | 1.19 | 1.13 | 1.02 | 1.29 | 1.54 | 1.59 | 1.49 | 1.48 | 1.47 | 1.85 | 1.99 |
| Dillingham | 1.25 | 1.24 | 0.57 | 0.31 | 0.44 | 0.59 | 0.80 | 0.96 | 0.84 | 0.88 | 0.90 | 0.81 | 0.69 | 0.51 | 0.94 | 0.37 | 0.46 | 0.24 | 0.44 | 0.17 | 0.11 |
| Fairbanks | 3.39 | 3.42 | 2.91 | 2.80 | 3.03 | 2.85 | 2.59 | 2.81 | 2.49 | 2.74 | 2.58 | 2.64 | 2.98 | 3.57 | 3.30 | 3.38 | 3.41 | 3.42 | 3.41 | 3.63 | 3.52 |
| Homer | 3.50 | 3.40 | 4.08 | 4.26 | 4.27 | 4.34 | 4.20 | 4.11 | 4.22 | 3.71 | 3.91 | 3.90 | 3.67 | 4.05 | 3.36 | 4.03 | 4.21 | 4.30 | 4.31 | 4.21 | 4.67 |
| Juneau | 4.00 | 4.28 | 5.04 | 5.53 | 5.87 | 6.37 | 6.76 | 6.68 | 6.87 | 6.62 | 7.12 | 7.97 | 7.92 | 8.52 | 8.53 | 8.94 | 9.22 | 8.16 | 7.90 | 7.81 | 8.44 |
| Kasilof | 0.60 | 0.51 | 0.59 | 0.67 | 0.75 | 0.70 | 0.85 | 0.84 | 1.01 | 0.97 | 0.79 | 0.83 | 0.92 | 0.91 | 0.78 | 0.92 | 0.93 | 1.05 | 0.83 | 1.05 | 0.90 |
| Kenai | 1.63 | 1.67 | 1.90 | 2.04 | 2.16 | 2.39 | 2.43 | 2.51 | 2.21 | 2.11 | 2.10 | 1.71 | 1.70 | 1.74 | 1.82 | 2.15 | 2.04 | 2.33 | 2.27 | 2.05 | 2.56 |
| Ketchikan | 5.09 | 5.57 | 6.13 | 6.35 | 6.26 | 5.97 | 6.06 | 5.99 | 6.15 | 5.89 | 6.39 | 6.44 | 6.55 | 6.21 | 6.26 | 6.54 | 6.44 | 5.12 | 5.10 | 5.15 | 5.22 |
| King Salmon | 1.38 | 1.37 | 0.81 | 0.79 | 0.97 | 1.50 | 1.39 | 1.60 | 1.53 | 1.69 | 1.60 | 1.84 | 1.50 | 2.00 | 2.19 | 2.08 | 2.18 | 1.87 | 1.69 | 1.93 | 1.97 |
| Kodiak | 2.98 | 2.70 | 3.05 | 3.09 | 3.35 | 3.17 | 3.21 | 3.51 | 3.68 | 3.68 | 3.66 | 3.51 | 3.67 | 3.77 | 3.67 | 3.51 | 3.40 | 3.58 | 3.65 | 3.58 | 3.75 |
| Ninilchik | 1.05 | 1.01 | 1.26 | 1.32 | 1.32 | 1.55 | 1.67 | 1.78 | 1.52 | 1.26 | 1.41 | 1.17 | 0.98 | 1.06 | 1.03 | 0.91 | 0.86 | 1.26 | 0.99 | 1.06 | 0.73 |
| North Pole | 0.73 | 0.74 | 0.72 | 0.71 | 0.87 | 0.65 | 0.62 | 0.66 | 0.60 | 0.66 | 0.74 | 0.57 | 0.82 | 0.99 | 1.07 | 1.14 | 0.98 | 1.21 | 1.32 | 1.12 | 0.86 |
| Palmer | 1.32 | 1.32 | 1.30 | 1.34 | 1.28 | 1.29 | 1.15 | 1.38 | 1.19 | 1.13 | 0.98 | 1.07 | 1.09 | 1.30 | 1.37 | 1.52 | 1.75 | 2.13 | 2.00 | 2.03 | 1.98 |
| Petersburg | 0.91 | 0.89 | 1.03 | 0.86 | 0.84 | 0.97 | 0.96 | 0.92 | 0.83 | 0.83 | 0.81 | 0.79 | 0.76 | 0.79 | 0.77 | 0.82 | 0.67 | 0.75 | 0.77 | 0.77 | 0.71 |
| Seward | 1.49 | 1.53 | 1.86 | 2.04 | 1.92 | 2.09 | 2.13 | 2.07 | 2.05 | 1.99 | 2.19 | 2.17 | 2.73 | 2.61 | 2.54 | 2.56 | 2.40 | 2.59 | 2.57 | 2.28 | 2.21 |
| Sitka | 4.47 | 4.67 | 5.41 | 5.44 | 5.22 | 5.58 | 4.99 | 4.97 | 5.22 | 5.08 | 5.15 | 5.51 | 5.07 | 5.00 | 5.20 | 5.32 | 5.50 | 5.50 | 4.96 | 5.41 | 5.49 |
| Soldotna | 6.10 | 6.30 | 7.34 | 7.91 | 8.04 | 8.16 | 7.91 | 8.04 | 7.96 | 7.84 | 7.98 | 7.42 | 6.83 | 6.52 | 6.81 | 7.21 | 6.49 | 6.97 | 6.81 | 6.93 | 7.24 |
| Sterling | 1.02 | 1.07 | 1.33 | 1.26 | 1.16 | 1.05 | 1.03 | 1.04 | 1.07 | 0.94 | 1.02 | 1.07 | 0.99 | 1.10 | 1.06 | 1.19 | 1.24 | 1.27 | 1.22 | 1.30 | 1.37 |
| Valdez | 1.14 | 1.10 | 1.13 | 1.11 | 1.07 | 1.14 | 1.15 | 1.19 | 1.11 | 1.21 | 1.23 | 1.24 | 1.11 | 0.83 | 0.81 | 0.89 | 0.81 | 1.11 | 1.08 | 0.95 | 0.88 |
| Wasilla | 3.15 | 3.03 | 3.10 | 3.14 | 3.27 | 3.52 | 3.80 | 4.11 | 3.88 | 3.95 | 4.10 | 3.88 | 4.19 | 4.02 | 3.97 | 3.89 | 4.27 | 4.93 | 5.07 | 5.07 | 5.08 |
| Yakutat | 0.89 | 0.75 | 0.86 | 0.82 | 0.78 | 0.94 | 0.92 | 1.00 | 1.04 | 1.00 | 1.22 | 1.20 | 1.09 | 1.13 | 1.13 | 1.23 | 1.20 | 1.10 | 1.07 | 1.00 | 1.07 |
| *Shaded cells are index scores above one (one standard deviation above the mean of zero) for at least one year (2003-2023) | |||||||||||||||||||||
Based on the community engagement index scores for recreational fishing engagement, communities were categorized into low (index scores below the mean of 0), medium (index scores between 0 and 0.5), medium-high (index scores between 0.50001 and 1), and high engagement (index scores above 1) for each year. The number of years a community is in each category for the recreational engagement indices is presented here in Table 6.3.
There are 79 communities or community groupings in Table 6.3 that had medium, medium-high, or high engagement in recreational fishing in Alaska for at least one year from 2003-2023, while only 23 communities were highly engaged in recreational fisheries in any year from 2003-2023. A total of 11 communities were highly engaged in all years over this period.
| Community | Low | Medium | Medium-High | High |
|---|---|---|---|---|
| Aleknagik | 5 | 16 | 0 | 0 |
| Anchor Point | 0 | 4 | 17 | 0 |
| Anchorage | 0 | 0 | 0 | 21 |
| Angoon | 2 | 19 | 0 | 0 |
| Aniak | 8 | 13 | 0 | 0 |
| Bethel | 4 | 17 | 0 | 0 |
| Big Lake | 5 | 16 | 0 | 0 |
| Cantwell | 9 | 12 | 0 | 0 |
| Chitina | 19 | 2 | 0 | 0 |
| Clam Gulch | 19 | 2 | 0 | 0 |
| Coffman Cove | 9 | 12 | 0 | 0 |
| Cold Bay | 14 | 7 | 0 | 0 |
| Cooper Landing | 0 | 0 | 6 | 15 |
| Copper Center | 0 | 21 | 0 | 0 |
| Cordova | 0 | 12 | 9 | 0 |
| Craig | 0 | 0 | 2 | 19 |
| Delta Junction | 0 | 21 | 0 | 0 |
| Dillingham | 0 | 8 | 11 | 2 |
| Eielson Air Force Base | 16 | 5 | 0 | 0 |
| Ekwok | 20 | 1 | 0 | 0 |
| Elfin Cove | 0 | 21 | 0 | 0 |
| Fairbanks | 0 | 0 | 0 | 21 |
| Fritz Creek | 19 | 2 | 0 | 0 |
| Gakona | 9 | 12 | 0 | 0 |
| Glennallen | 10 | 11 | 0 | 0 |
| Goodnews Bay | 15 | 6 | 0 | 0 |
| Gustavus | 0 | 19 | 2 | 0 |
| Haines | 0 | 19 | 2 | 0 |
| Homer | 0 | 0 | 0 | 21 |
| Hoonah | 0 | 21 | 0 | 0 |
| Hope | 20 | 1 | 0 | 0 |
| Houston | 19 | 2 | 0 | 0 |
| Igiugig | 18 | 3 | 0 | 0 |
| Iliamna | 0 | 14 | 7 | 0 |
| Juneau | 0 | 0 | 0 | 21 |
| Kasilof | 0 | 0 | 18 | 3 |
| Kenai | 0 | 0 | 0 | 21 |
| Ketchikan | 0 | 0 | 0 | 21 |
| King Salmon | 0 | 0 | 3 | 18 |
| Klawock | 0 | 15 | 6 | 0 |
| Kodiak | 0 | 0 | 0 | 21 |
| Larsen Bay | 0 | 21 | 0 | 0 |
| Moose Pass | 14 | 7 | 0 | 0 |
| Nikiski | 3 | 18 | 0 | 0 |
| Ninilchik | 0 | 0 | 5 | 16 |
| Nome | 10 | 11 | 0 | 0 |
| Nondalton | 20 | 1 | 0 | 0 |
| North Pole | 0 | 0 | 16 | 5 |
| Old Harbor | 10 | 11 | 0 | 0 |
| Palmer | 0 | 0 | 1 | 20 |
| Pedro Bay | 18 | 3 | 0 | 0 |
| Pelican | 0 | 21 | 0 | 0 |
| Petersburg | 0 | 0 | 20 | 1 |
| Port Alexander | 16 | 5 | 0 | 0 |
| Port Alsworth | 0 | 21 | 0 | 0 |
| Port Lions | 0 | 21 | 0 | 0 |
| Quinhagak | 15 | 6 | 0 | 0 |
| Seldovia | 4 | 17 | 0 | 0 |
| Seward | 0 | 0 | 0 | 21 |
| Sitka | 0 | 0 | 0 | 21 |
| Skagway | 6 | 15 | 0 | 0 |
| Skwentna | 1 | 20 | 0 | 0 |
| Soldotna | 0 | 0 | 0 | 21 |
| Sterling | 0 | 0 | 2 | 19 |
| Sutton-Alpine | 20 | 1 | 0 | 0 |
| Talkeetna | 0 | 2 | 19 | 0 |
| Thorne Bay | 0 | 19 | 2 | 0 |
| Togiak | 11 | 10 | 0 | 0 |
| Tok | 20 | 1 | 0 | 0 |
| Two Rivers | 13 | 8 | 0 | 0 |
| Unalakleet | 5 | 16 | 0 | 0 |
| Unalaska Dutch Harbor | 8 | 13 | 0 | 0 |
| Valdez | 0 | 0 | 6 | 15 |
| Wasilla | 0 | 0 | 0 | 21 |
| Waterfall | 20 | 1 | 0 | 0 |
| Whittier | 7 | 14 | 0 | 0 |
| Willow | 0 | 19 | 2 | 0 |
| Wrangell | 0 | 20 | 1 | 0 |
| Yakutat | 0 | 0 | 7 | 14 |
National Oceanic and Atmospheric Administration. (2019, June 3). Alaska’s valuable recreational fishing industry. NOAA Fisheries. Retrieved November 15, 2024, from https://www.fisheries.noaa.gov/feature-story/alaskas-valuable-recreational-fishing-industry↩︎