Seattle MSA
Area Description & History
The Seattle Metropolitan Statistical Area (Seattle MSA) is an urban conglomeration in Washington state comprising three of the three most populous counties—King, Pierce, Snohomish—and includes the Pacific Northwest’s largest city, Seattle. The area has long had a vital role in Alaska commercial fisheries, with 75% of Alaska’s commercial fishing vessels mooring, docking, and conducting repairs in Seattle. Before Seattle and its suburbs became home to a technology industry, logging was its first major industry. Later in the 19th century, the city became the gateway to Alaska with newfound commercial and shipbuilding industries. For over 100 years, commercial fishers in Seattle have traveled to work and fish in Alaska waters.1 Commercial fishermen use the three core facilities in the Port of Seattle including Fishermen’s Terminal, Maritime Industrial Center, and Terminal 91.2
Demographics
We attempted to isolate data used to the Seattle MSA to the degree possible; however in some cases accessible datasets were based on the broader Puget Sound Region. There are strong social and economic linkages across the region, however we isolated Seattle MSA data where possible. With a population just over 4 million, the Seattle MSA is the largest community in Washington state and supports Alaska fisheries through supplying crew members, captains, as well as the vessels themselves. On average from 2018-2022, the Seattle MSA had a median household income of over $107,000 and had over 1.65 million housing units.
| Demographics | |
| Population | 4,001,701 |
| Median household income | $107,206 |
| Housing units | 1,657,075 |
| Percentages | |
| Male | 50.6% |
| Female | 49.4% |
| White | 63.0% |
| American Indian or Alaska Native | 0.8% |
| Black or African American | 6.0% |
| Asian | 15.0% |
| Native Hawaiian or Pacific Islander | 0.9% |
| Hispanic or Latino | 7.7% |
| Below poverty line | 8.3% |
| High school diploma or higher | 93.2% |
| Population under 5 | 5.7% |
| Population over 18 | 79.0% |
| Population over 65 | 13.8% |
| Source: US Census Bureau American Community Survey 5-year estimates (2018-2022) | |
Current Economy
Seattle MSA plays an integral role in Alaska commercial fisheries. Seattle is the home port to 300 vessels with 226 of those involved in fishing Alaska waters for Pollock, Alaskan king crab, groundfish, and salmon.3 Alaskan fisheries account for an annual harvest greater than all other U.S. states combined, adding more than $4 billion dollars in sales annually to the U.S. economy.4
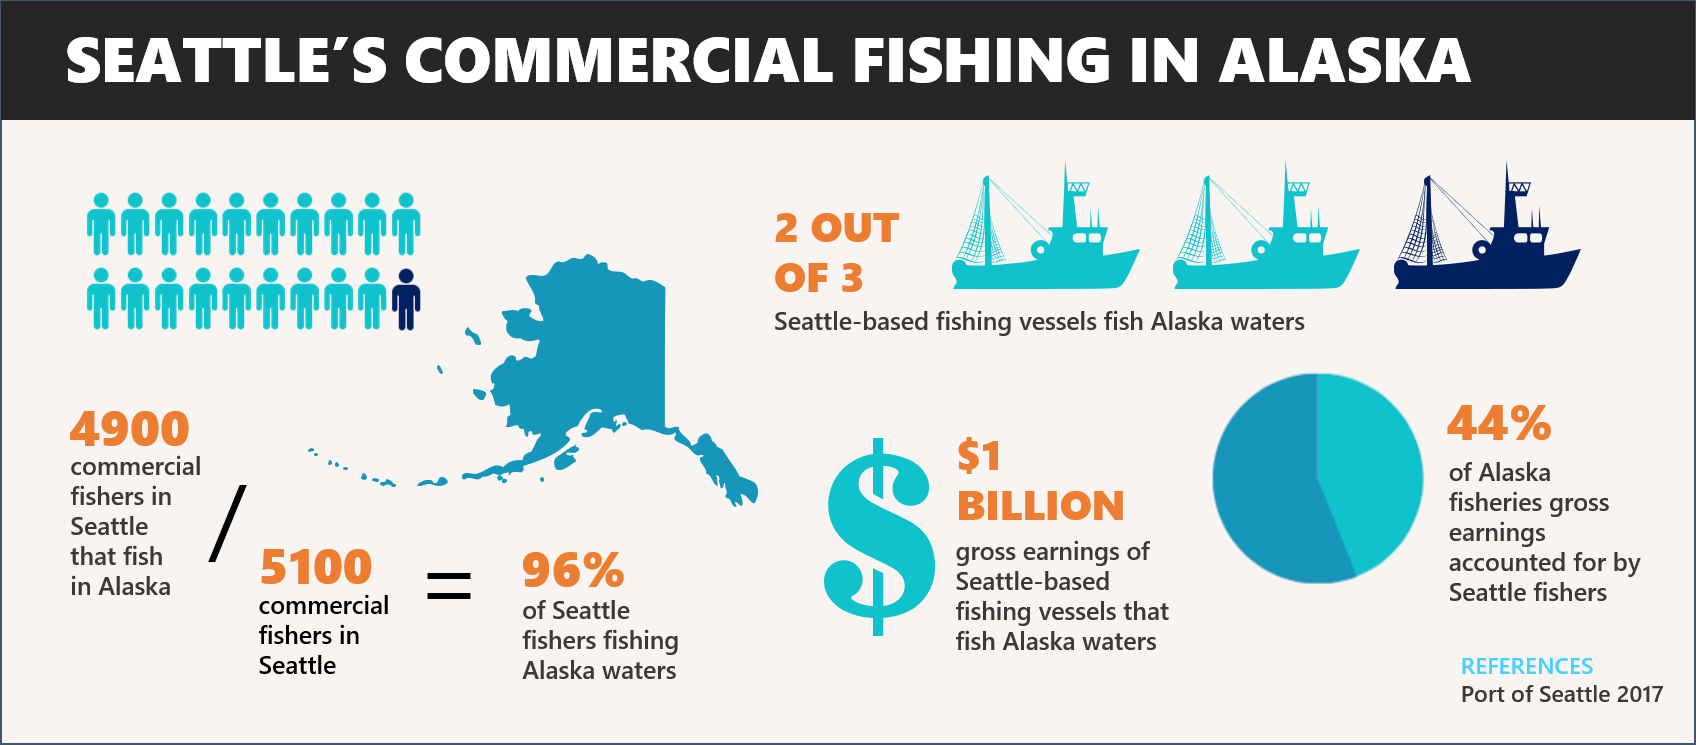
In 2017*, the Seattle MSA’s commercial fishing industry supplied 7,200 jobs. Of that, 5,100 individuals worked on fishing vessels, and 4,900 of those fished in Alaskan waters, supporting over $313 million in labor ($150 million in fishing employment; $163 million in onshore labor). In the same year, commercial fishing operations through the Port of Seattle generated $13.2 million in taxes to Washington State.5
To gain understanding of the economic and social linkage between Seattle and Alaska fisheries, the following sections highlight: 1) seafood processing sector, 2) observer programs, 3) fleet modernization efforts, and 4) shipping operations in the Seattle MSA region. This information can provide information on how communities interact, work to support adaptation and resilience in the face of global change.
* Most recent data available was used.
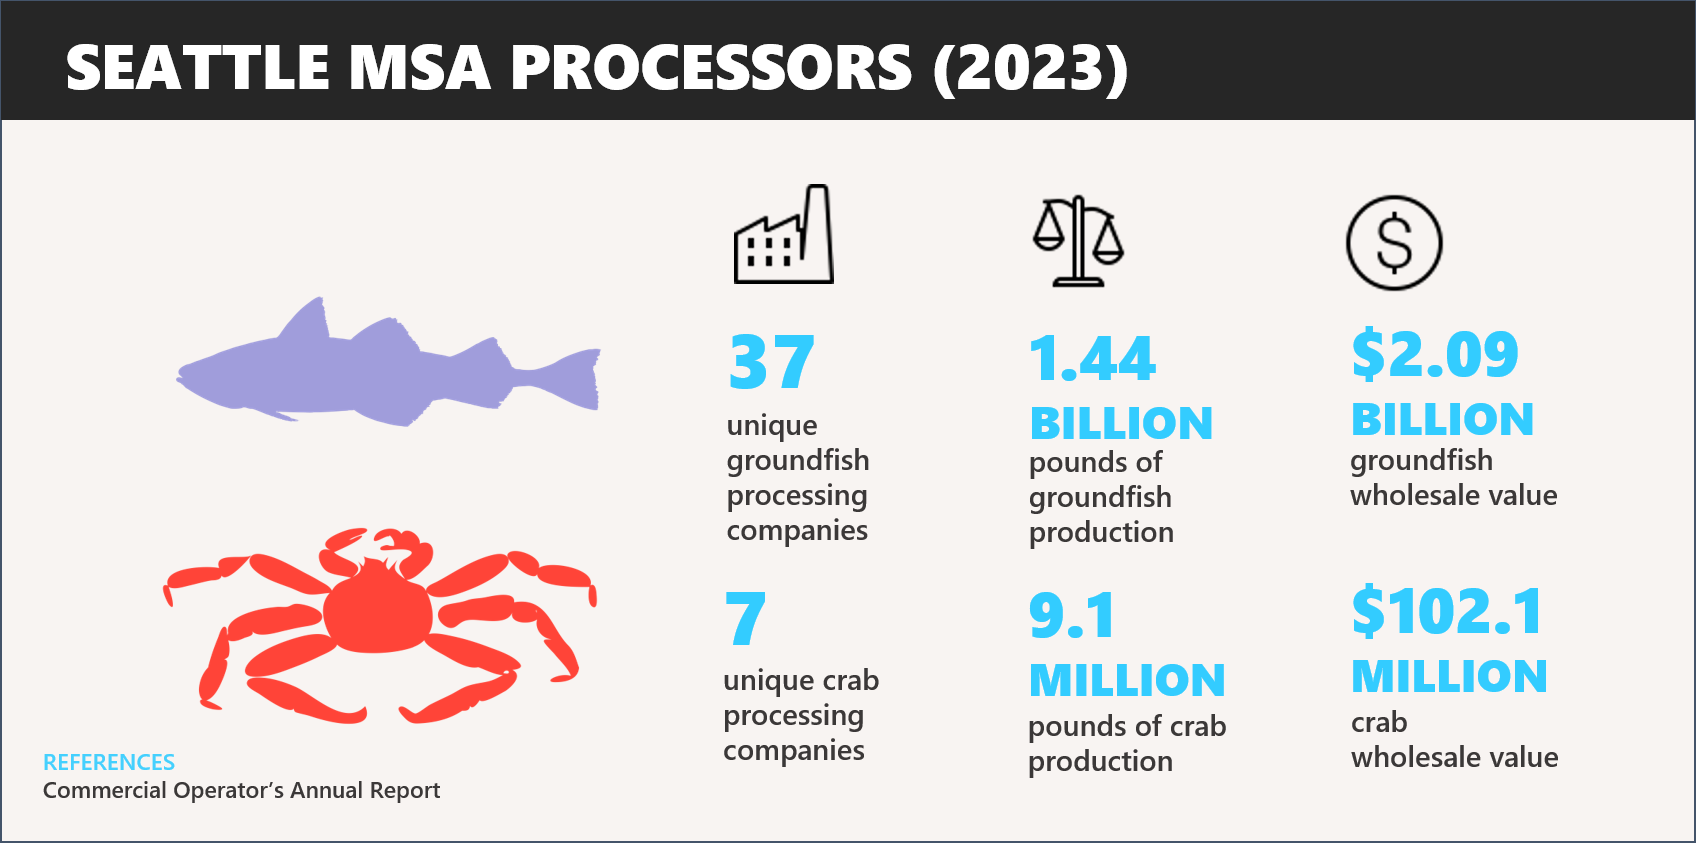
Seafood Processors
In 2023, 37 groundfish and 7 crab processors had headquarters located in the Seattle MSA (including both at-sea and shore-based operations). These company’s facilities processed 1.44 billion pounds of groundfish worth $2.09 billion, and 9.1 million pounds of crab worth $102 million4 across all fisheries. Disaggregated data for total revenue from Alaska catch were not yet available; however, 96% of Seattle fishing vessels fish in Alaskan waters, and of that, 44% of Alaska commercial fisheries’ gross earnings is accounted for by Seattle-based fishers.6 The figure below presents the pounds of production and wholesale value of groundfish and crab processed in the Seattle MSA. In order to better understand the social and economic linkages, how these connections may change with climate change, and the localized effects requires continued work with the best available disaggregated data.
Observer Programs
In addition to the many Alaska fishing vessels who dock, moor, and conduct repairs in the Seattle MSA, several organizations provide trained observers for Alaska fisheries. These entities operate out of the Seattle MSA with earnings contributing to Washington and the broader Nation’s economy. For example, The North Pacific Observer Program (NPOP) began in 1990 to provide observers to vessels participating in Alaska’s groundfish fishery. These observers are available year-round to meet industry coverage requirements and Federal mandates.7 According to the 2021 North Pacific Observer Program Annual Report, Washington-based observer programs operating in Alaska fisheries contributed nearly $17 million to the Washington state economy.8 The data used here derives from summary statistics from invoices submitted by at least three observer providers to meet confidentiality requirements
Fleet Modernization & Maintenance
In addition to processor and observer activities conducted in Seattle MSA, fleet modernization activities contribute millions of dollars per year to Washington’s economy. An estimated $800 million will be spent in fleet modernization activities in the Puget Sound between the years 2017 and 20269 contributing to Seattle MSA’s fisheries related expenditures.
Fishing History & Regulatory Background
For over 100 years, the Seattle fleet has fished Alaskan waters. With immigrants from Scandinavia arriving in the 1880’s, these same groups brought their skills in fishing and maritime activities to the Pacific Northwest. The Puget Sound Fisheries Association Committee, which founded Fisherman’s Terminal, was composed of primarily Norwegian immigrants.10 On January 10, 1914, over 200 fishing vessels hailed from Olympia, Washington to Alaska, marking the opening of, “Fishermen’s Headquarters,” known today as Fishermen’s Terminal that is home to a significant North Pacific fishing fleet.11 In the 1960s – 1980s, there was a boom in Alaska fisheries as commercial harvests decreased in other locations, many commercial fishermen from other areas ventured into Alaskan waters. Oral history research on fishermen residing in the broader Pacific Northwest, who participate in Alaska Federal fisheries, identified factors that led them to engage in Alaska fisheries. These included established social connections, expanded opportunities, sense of adventure, and economic possibilities.12 Today, two out of three Seattle MSA vessels fish in Alaska.13
Climate Change Vulnerability & Adaptive Capacity
Due to the distinct nature of the Seattle MSA compared to other highly engaged communities, social indicators and levels of engagement have not been included for Seattle MSA’s involvement in Alaska commercial fisheries. Instead, a discussion of the vulnerability and adaptive capacity to climate risk for the Seattle MSA’s commercial fishing industry is included here to inform understandings of climate effects on Seattle’s economy and coastal infrastructure. Finally, this section highlights several gaps in knowledge necessary to explore the adaptive capacity and climate vulnerability within Seattle MSA fisheries.
The city of Seattle is predicted to get increasingly warmer temperatures and episodes of heatwaves. Drier summers and wetter winters are also expected with increased chances of extreme precipitation events. Sea levels are expected to rise up to nine inches by the 2030s, and storm surges and high tides will periodically increase these levels.14 The climate driven shifts in distribution and abundance of commercial fisheries in Alaska will likely affect the sustained participation of Seattle MSA in Alaska federal fisheries; however, there is a great deal of uncertainty.
The Port of Seattle has developed $1.6 billion in modernization projects and mitigation measures to address projected climate risks to the port and fisheries operations.1516 These efforts include increased fuel efficiency and improved processing capacity. Approximately 50% of all fleet modernization plans are expected to take place in Puget Sound. Additional research is necessary to inform climate ready fisheries
Groundfish Harvesting Engagement - HIGH
Seattle MSA has the highest degree of groundfish harvesting engagement in Alaskan waters over time compared to all other Alaska communities. The volume of groundfish harvested reached its peak in 2016 at almost 3.8 million pounds. Pounds of groundfish harvested began increasing significantly starting in 2011 and remained high through 2019 but have since declined over the past four years. This may have initially been due to COVID19 pandemic effects on maintaining crew, difficulties with travel, plant closures, and overall safety concerns but these patterns persist into 2023. Similarly, the ex-vessel value of groundfish harvested by Seattle owned vessels experienced an increase in ex-vessel value in 2011 and was relatively stable until 2019 and has been generally declining since with the exception of 2022 which increased revenues despite lower volume of harvests.
Groundfish fishing vessels owned by Seattle residents continued a slight downward trend from a peak of 239 in 2008 to 154 in 2023. The 154 vessels owned by Seattle residents in 2023 reflects another all time low since 2008. Between 2019 and 2023, there was a 17% decrease in fishing vessels owned by Seattle residents fishing in Alaska (32 vessels).
Groundfish Processing Engagement - LOW
Despite a large number of groundfish processing companies being headquartered in the Seattle MSA area, there is not a substantial amount of Alaska groundfish processing activity in Seattle to report as nearly all of the primary processing occurs at plants located in Alaska.
Crab Harvesting Engagement - HIGH
Seattle’s resident vessels harvesting BSAI crab fisheries saw a dramatic decline in both harvest volume and associated value beginning in 2017 when harvest decreased by 17,441,359 pounds (46%) and $46.9 million (32%). Harvest volumes increased through 2021 until closures of both Bristol Bay red king crab and Bering Sea snow crab fisheries dropped to record lows in calendar years 2022 and 2023. Seattle vessels also benefited from high crab ex-vessel and first-wholesale prices in 2021 which resulted in a record high level of (real) revenue over this period despite relatively low historical volumes.
The number of crew residing in Seattle who engage in FMP crab fisheries has decreased sharply beginning in 2020, likely as a result of travel restrictions associated with the COVID-19 pandemic, with a decrease in 55 crewmembers harvesting BSAI or 41% between 2019 and 2020. This number rebounded slightly in 2021 to 108 crewmembers but continued its downward trend since 2015 and reached a new low in 2023 of 60 crewmembers. Similarly, Seattle MSA based quota share (QS) holders has been declining since 2015 when it was near its high of 258 QS holders to a new low of 207 in 2023.
Crab Processing Engagement - LOW
Despite a large number of crab processing companies being headquartered in the Seattle MSA area, there is not a substantial amount of Alaska crab processing activity in Seattle to report as nearly all of the primary processing occurs at plants located in Alaska.
Ott, J. (2017, December 1). Fishermen’s Terminal (Seattle). HistoryLink.org Essay 20488. Retrieved November 14, 2024 from https://www.historylink.org/file/20488.↩︎
Swift, C. (2019). Five Fast Facts about Commercial Fishing. Port of Seattle. Accessed May 25, 2022 from https://www.portseattle.org/blog/five-fast-facts-about-commercial-fishing↩︎
Swift, C. (2019). Five Fast Facts about Commercial Fishing. Port of Seattle. Accessed May 25, 2022 from https://www.portseattle.org/blog/five-fast-facts-about-commercial-fishing↩︎
Swift, C. (2019). Five Fast Facts about Commercial Fishing. Port of Seattle. Accessed May 25, 2022 from https://www.portseattle.org/blog/five-fast-facts-about-commercial-fishing↩︎
National Marine Fisheries Service (NMFS). (2017). Fisheries Economics of the United States, 2015. U.S. Dept. of Commerce, NOAA Tech. Memo. NMFS-F/SPO-170, 247 p.↩︎
Swift, C. (2019). Five Fast Facts about Commercial Fishing. Port of Seattle. Accessed May 25, 2022 from https://www.portseattle.org/blog/five-fast-facts-about-commercial-fishing↩︎
National Oceanic and Atmospheric Administration (NOAA). (n.d.). Fisheries Monitoring and Analysis Division history. NOAA Fisheries. https://www.fisheries.noaa.gov/alaska/fisheries-observers/fisheries-monitoring-and-analysis-division-history↩︎
Alaska Fisheries Science Center and Alaska Regional Office. (2021). North Pacific Observer Program 2020 Annual Report. AFSC Processed Rep. 2021 2021-03, 143 p. Alaska Fish. Sci. Cent., NOAA, Natl. Mar. Fish. Serv., 7600 Sand Point Way NE, Seattle WA 98115.↩︎
Modernization of the North Pacific Fishing Fleet: Economic Opportunity Analysis. (2016). McDowell Group. https://www.portseattle.org/sites/default/files/2018-03/Fleet%20Modernization%20Final%2011_11.pdf↩︎
Forssblad, M. (2001). Norwegians in Seattle and King County. HistoryLink.org Essay 3476. https://www.historylink.org/file/3476.↩︎
Port of Seattle. Fishermen’s Terminal History. https://www.portseattle.org/page/fishermens-terminal-history↩︎
Kahrs, Jeffrey. (2015-2018). Commercial Fishermen Oral History Project with commercial fishers in Seattle (Collection Number: 2018.63) Museum of History & Industry, Sophie Frye Bass Library. Seattle, WA. https://archiveswest.orbiscascade.org/ark:/80444/xv988280#dscID↩︎
Swift, C. (2019). Five Fast Facts about Commercial Fishing. Port of Seattle. Accessed May 25, 2022 from https://www.portseattle.org/blog/five-fast-facts-about-commercial-fishing↩︎
Port of Seattle. 2016. Sea Level Rise Considerations. https://www.portseattle.org/sites/default/files/2018-03/T5_FEIS_volume_II_Appx_I.pdf↩︎
Modernization of the North Pacific Fishing Fleet: Economic Opportunity Analysis. (2016). McDowell Group. https://www.portseattle.org/sites/default/files/2018-03/Fleet%20Modernization%20Final%2011_11.pdf↩︎
City of Seattle. 2013. Climate Action Plan. https://www.seattle.gov/documents/Departments/Environment/ClimateChange/2013_CAP_20130612.pdf↩︎